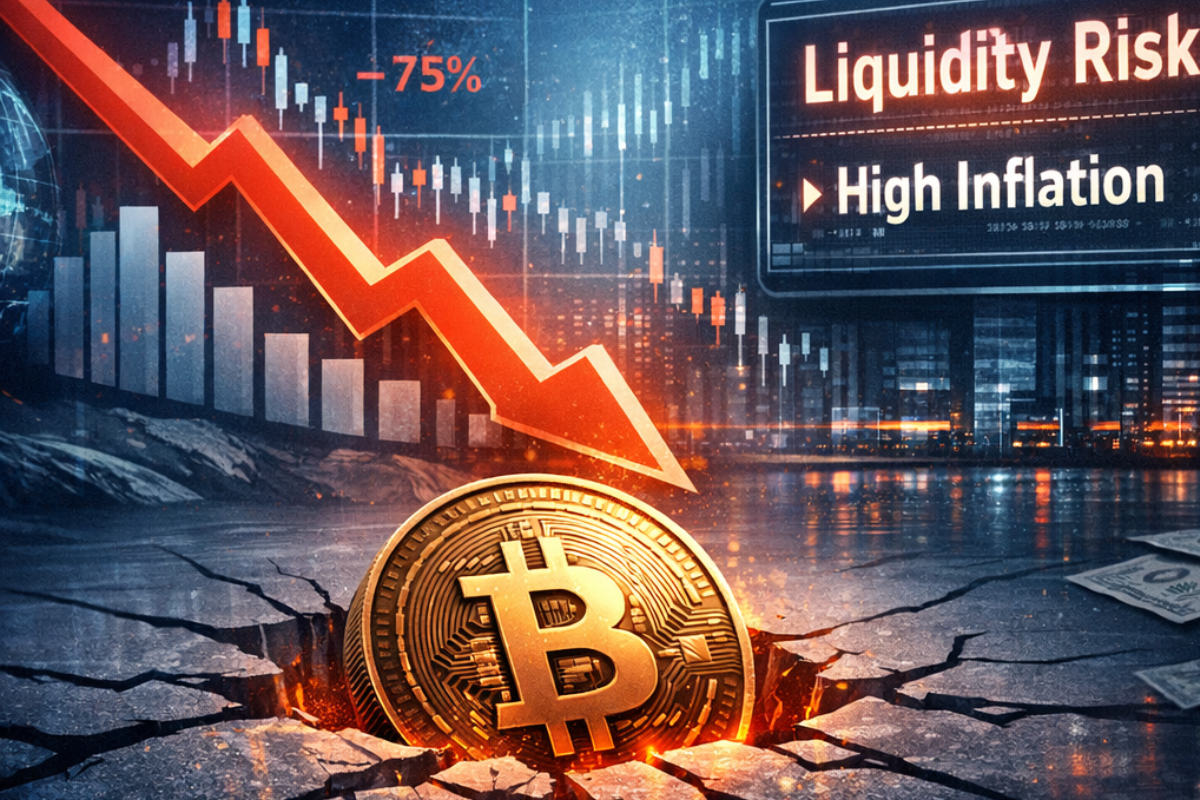
The Psychology of Capitulation: How 9 Million BTC Held at a Loss Creates a Technical and Behavioral Ceiling
On-chain analytics reveal a challenging structural dynamic for Bitcoin: approximately 9 million BTC—nearly half of the circulating supply—was acquired at price levels significantly higher than current market value. This distribution creates a formidable "supply wall" of break-even selling pressure that has repeatedly thwarted recovery attempts and contributed to the asset's prolonged consolidation phase.
The Break-Even Selling Mechanism: Psychology Meets On-Chain Reality
When a large portion of an asset's supply is held at a loss, price rallies often trigger reflexive selling from investors seeking to recover their initial capital. This behavioral pattern—known as break-even selling—creates a self-reinforcing ceiling on price appreciation:
Dynamic | Mechanism | Market Impact |
|---|---|---|
Underwater Supply | ~9M BTC acquired above current price (~$60K–$70K range) | Large pool of potential sellers at modest rallies |
Break-Even Thresholds | Investors target entry price as exit point to avoid realizing loss | Supply floods market as price approaches prior demand zones |
Rally Suppression | Every upward move meets immediate selling from loss-averse holders | Bullish momentum stalls; consolidation extends |
Sentiment Feedback Loop | Repeated failed rallies deepen pessimism; buyer interest wanes | Reduced marginal demand reinforces sideways price action |
This dynamic helps explain why Bitcoin has struggled to sustain advances above the $66,000–$70,000 resistance band despite periodic attempts: each bounce activates a tranche of sellers whose primary objective is capital preservation, not profit-taking.
Institutional Disinterest and the Demand Gap
Compounding the supply-side pressure is a notable absence of aggressive buying from new or institutional participants:
Factor | Current Observation | Implication |
|---|---|---|
ETF Flow Trends | Net outflows or muted inflows in recent sessions | Mechanical spot demand absent during dips |
Corporate Treasury Activity | Limited new announcements of Bitcoin accumulation | Institutional conviction appears selective, not broad-based |
Custody Platform Growth | Stable or declining new wallet creation metrics | Fresh capital not deploying aggressively into weakness |
Macro Liquidity Conditions | Elevated real yields, dollar strength persist | Risk-asset allocation remains constrained |
Bloomberg analysts have characterized this configuration as one of the most severe "price traps" in recent Bitcoin cycles. Their assessment: absorbing the supply released during every bounce would require an unprecedented influx of institutional capital—a threshold that has not yet been met.
Exchange Flows: Latent Selling Readiness
On-chain data from major exchanges reinforces the cautious posture among holders:
Rising BTC Deposits: Increased transfers to exchange wallets signal preparation to sell if price approaches key resistance levels.
Stablecoin Balance Trends: Drifting lower on exchanges, suggesting capital is being off-ramped to fiat rather than redeployed within crypto markets.
Volume Profile: Elevated activity during rallies but thin participation during consolidation, consistent with distribution rather than accumulation.
These patterns align with what analysts describe as a "silent capitulation" phase: not a panic-driven flush, but a gradual erosion of conviction as time and sideways price action test holder patience.
Technical Structure: Consolidation Range and Key Levels
From a charting perspective, Bitcoin's current posture reflects a market in equilibrium between supply overhang and residual demand:
Level | Significance | Current Status |
|---|---|---|
$70,000 | Psychological resistance; break-even cluster for many underwater holders | Major supply zone; repeated rejection |
$66,000 | Intermediate support; prior consolidation base | Tested frequently; holding for now |
$63,000 | ~50% correction from ~$126K peak; technical measured move | Key support; breach could accelerate selling |
$56,000–$58,000 | Realized price and 200-week SMA; structural demand confluence | Next major base if $63K fails |
$50,000 | Options market reference; deep correction threshold | Tail-risk scenario requiring severe macro deterioration |
Confirmation Signals to Monitor:
A sustained daily close above $70,000 with volume expansion would begin to neutralize the immediate supply overhang.
Declining exchange deposits coupled with rising outflows would signal absorption of latent supply.
Stablecoin balance stabilization or growth would indicate fresh capital re-entering the ecosystem.
The Role of Time: "Silent Capitulation" as a Cleaning Mechanism
Analysts note that in the absence of a major catalyst—either a demand surge or a forced supply purge—time itself may serve as the primary mechanism for resolving the current imbalance:
"The market appears to be in a phase of silent capitulation, where time is the only remaining cleaning factor."
This process unfolds through:
Gradual Loss Realization: Some underwater holders eventually accept losses and exit, reducing the supply overhang.
Cost Basis Convergence: As price consolidates, the average acquisition price of active traders converges toward current levels, diminishing break-even pressure.
Sentiment Reset: Extended consolidation can exhaust both bulls and bears, creating conditions for a more decisive move once a catalyst emerges.
However, this path requires patience: the timeline for resolution is uncertain, and prolonged stagnation can test conviction among even long-term holders.
Forward Scenarios: Defining Risk and Opportunity
For investors evaluating Bitcoin's trajectory through the remainder of the quarter, two conditional frameworks merit consideration:
Continued Consolidation Scenario:
Break-even selling persists at $66,000–$70,000 resistance
Institutional flows remain muted; ETF redemptions continue modestly
Macro headwinds (real yields, dollar strength) persist
Implication: Sideways trading between $60,000 and $70,000 extends; volatility compresses; patience required
Breakout/Breakdown Scenario:
Catalyst | Bullish Resolution | Bearish Resolution |
|---|---|---|
Demand Surge | Unprecedented institutional inflows absorb supply; price reclaims $70K+ with volume | — |
Supply Purge | — | Forced selling from leveraged holders or corporate treasuries accelerates; price breaks $63K toward $56K–$58K |
Macro Shift | Fed dovish pivot; real yields decline; dollar weakens | Hawkish surprise; geopolitical escalation; risk-off rotation intensifies |
Regulatory Clarity | CLARITY Act advancement; stablecoin framework passed | Continued gridlock; enforcement uncertainty persists |
Analytical Balance: Supply Overhang vs. Structural Adoption
While the current supply dynamics present near-term challenges, prudent analysis requires contextualizing these pressures within longer-term trends:
Constructive Signal | Risk Consideration |
|---|---|
Historical precedent: Bitcoin has resolved similar supply overhangs through time or catalysts | Current underwater supply (~9M BTC) represents a larger absolute quantity than in prior cycles |
Institutional infrastructure (custody, ETFs) remains intact despite price weakness | Break-even selling can persist longer than anticipated if sentiment remains fragile |
On-chain transparency allows real-time monitoring of supply distribution | Technical breakdowns can accelerate if key support ($63K) fails with volume |
Tokenized RWA growth shows blockchain utility beyond pure speculation | Macro headwinds may dominate crypto-specific catalysts in near term |
Key Variables to Monitor
Indicator | Bullish Confirmation | Bearish Continuation |
|---|---|---|
Underwater Supply Metric | Decline in BTC held at a loss via price appreciation or loss realization | Persistence or growth in loss-held supply |
Exchange Net Flows | Outflows exceed inflows; latent supply absorbed | Continued net deposits signal selling readiness |
ETF Flow Trends | Sustained net inflows restoring marginal spot demand | Persistent outflows reinforcing mechanical selling pressure |
Technical Structure | Reclaim of $70,000 with volume expansion | Failure to hold $63,000; lower lows extend |
Macro Liquidity | Real yields drift lower; dollar stabilizes or weakens | Tightening financial conditions; risk-off sentiment dominates |
Conclusion: Patience Amid Structural Resolution
Bitcoin's current consolidation phase reflects a complex interplay of on-chain supply dynamics, behavioral psychology, and macro liquidity conditions. The presence of ~9 million BTC held at a loss creates a tangible supply overhang that activates break-even selling during rallies, while the absence of aggressive institutional buying leaves demand insufficient to absorb that supply.
For investors, the takeaway is methodological:
Monitor on-chain metrics (underwater supply, exchange flows) alongside technical structure and macro indicators
Recognize that "silent capitulation" is a process, not an event; resolution may require time, catalysts, or both
Maintain disciplined risk parameters during extended consolidation, as patience is often tested before clarity emerges
In volatile, adaptive markets, preparation and multi-factor analysis often prove more valuable than conviction in any single narrative—whether bullish or bearish.
Disclaimer: This report is for informational purposes only and does not constitute financial, legal, or investment advice. Cryptocurrency markets are highly volatile and subject to rapid change; readers should conduct independent research, verify on-chain data through primary sources such as blockchain explorers, CryptoQuant, and Glassnode, monitor macro developments via official central bank communications, and consult qualified professionals before making allocation decisions. On-chain metrics are descriptive, not predictive; past relationships do not guarantee future behavior. Digital asset investments involve substantial risk of loss, including potential total loss of principal.